Visualization
AI-powered visualization
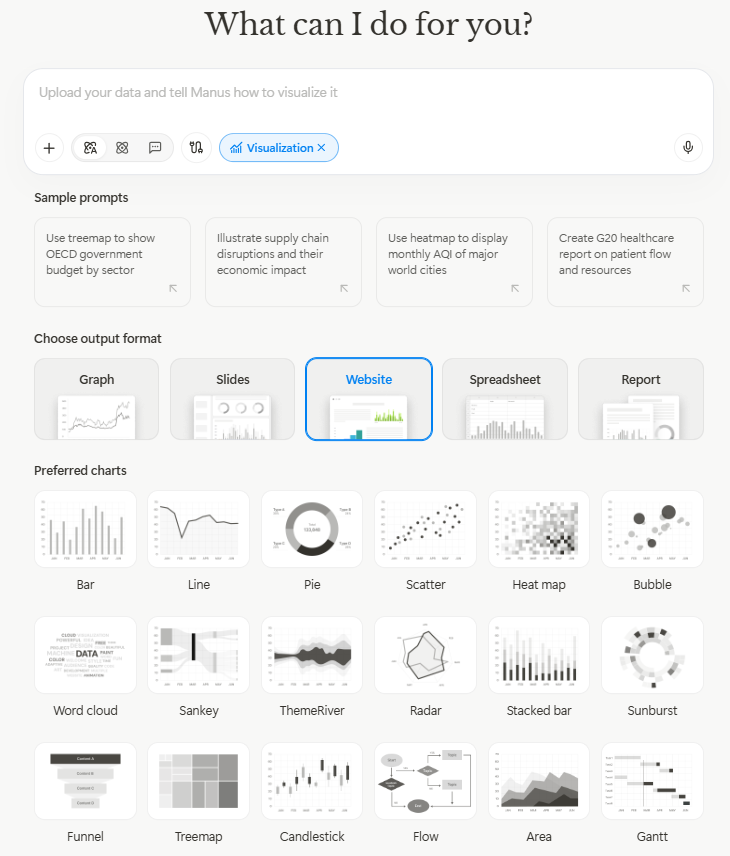
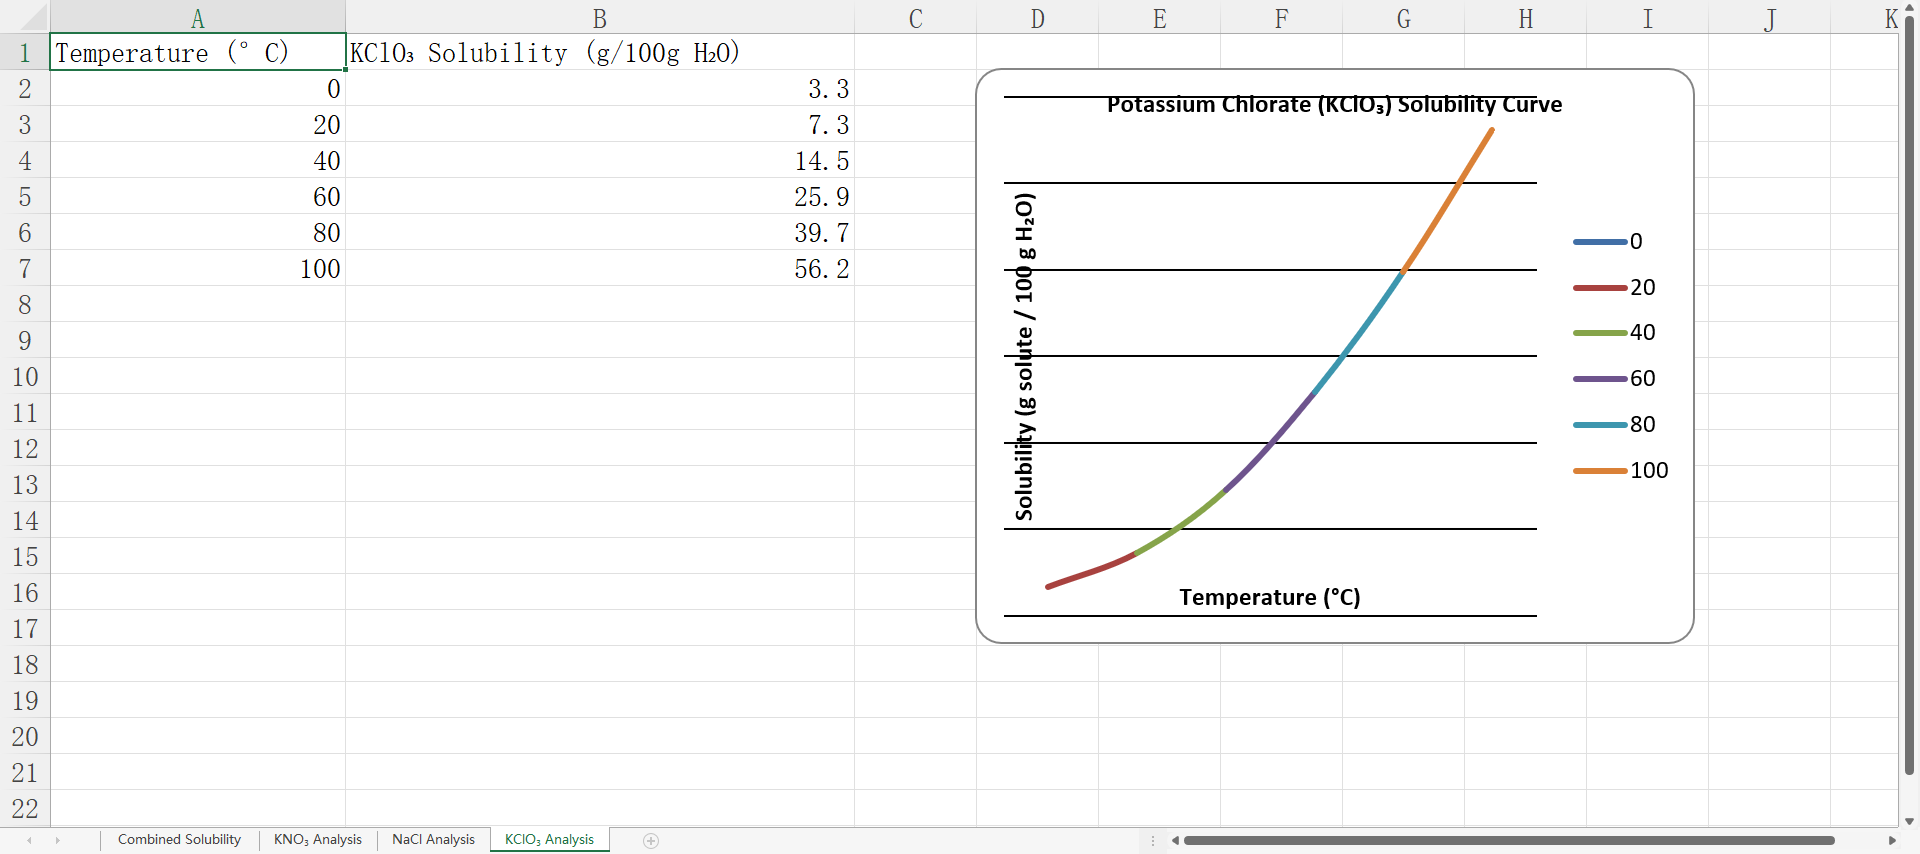
Here are some examples of Data visualization function. These functions helpstudents to generate professional, publication-quality graphs, such as solubility curves or reaction rate plots by directly mapping their tabulated data onto the axes. By offering real-time selection of chart types an ontrols for axis labels, title, and color scheme, this feature allow for the creation and iteration of visuals that accurately and clearly communicate complex chemical phenomena to the students.
Spreadsheet Generator
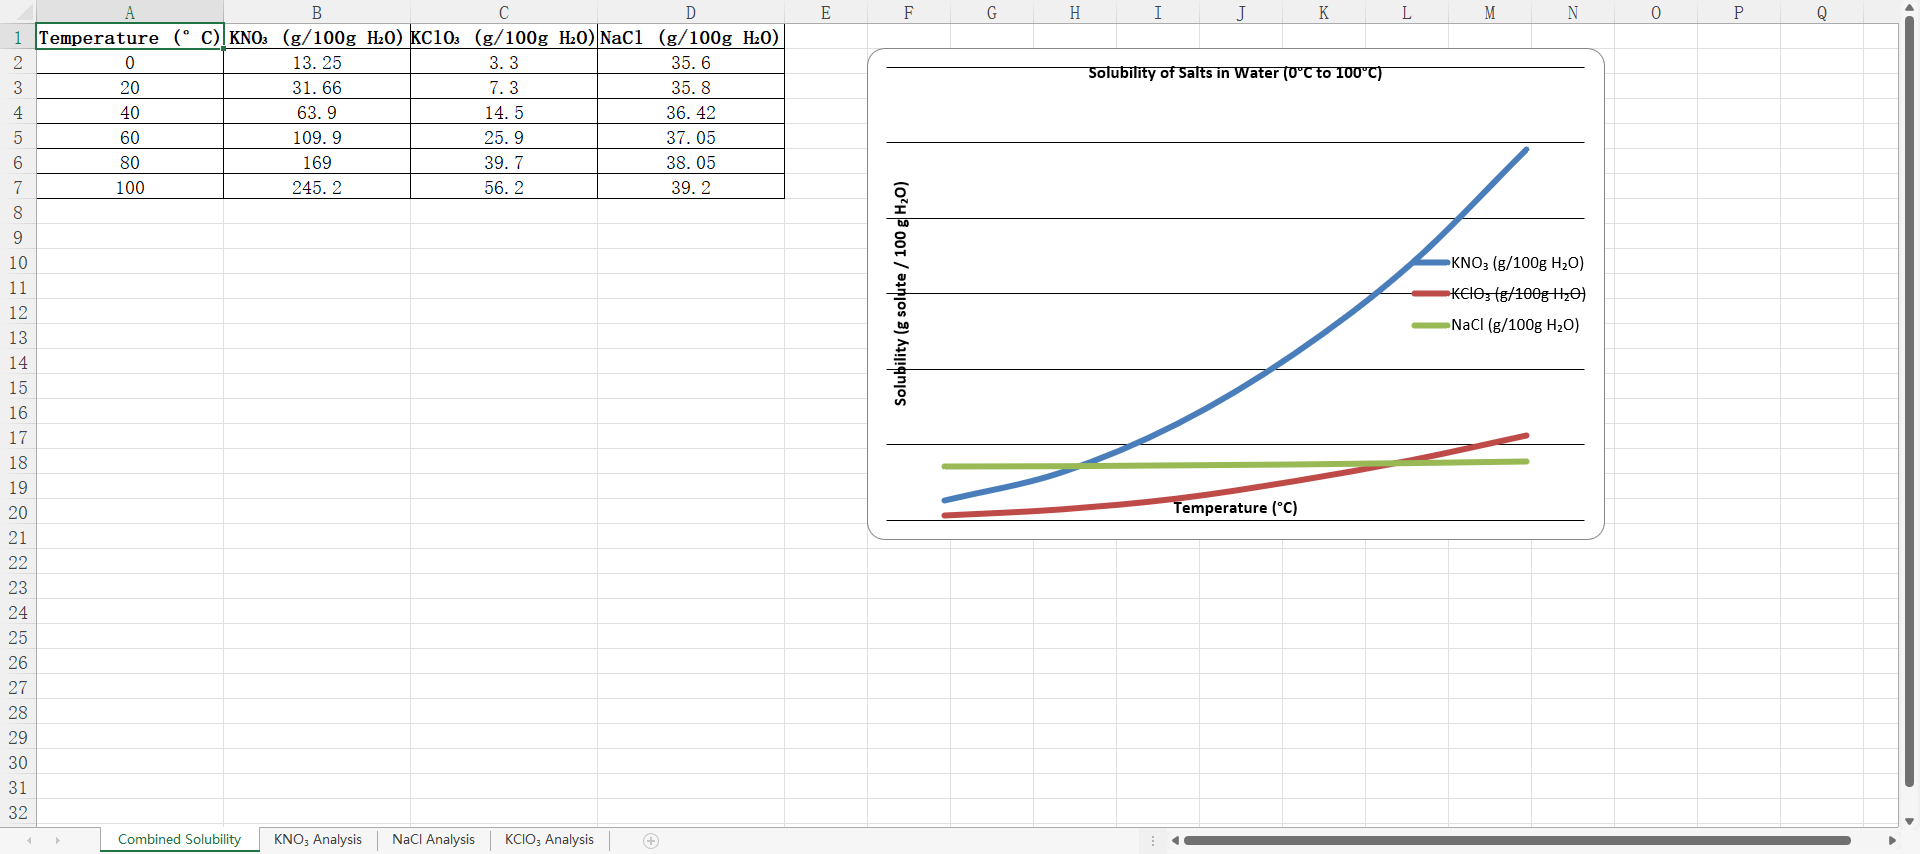
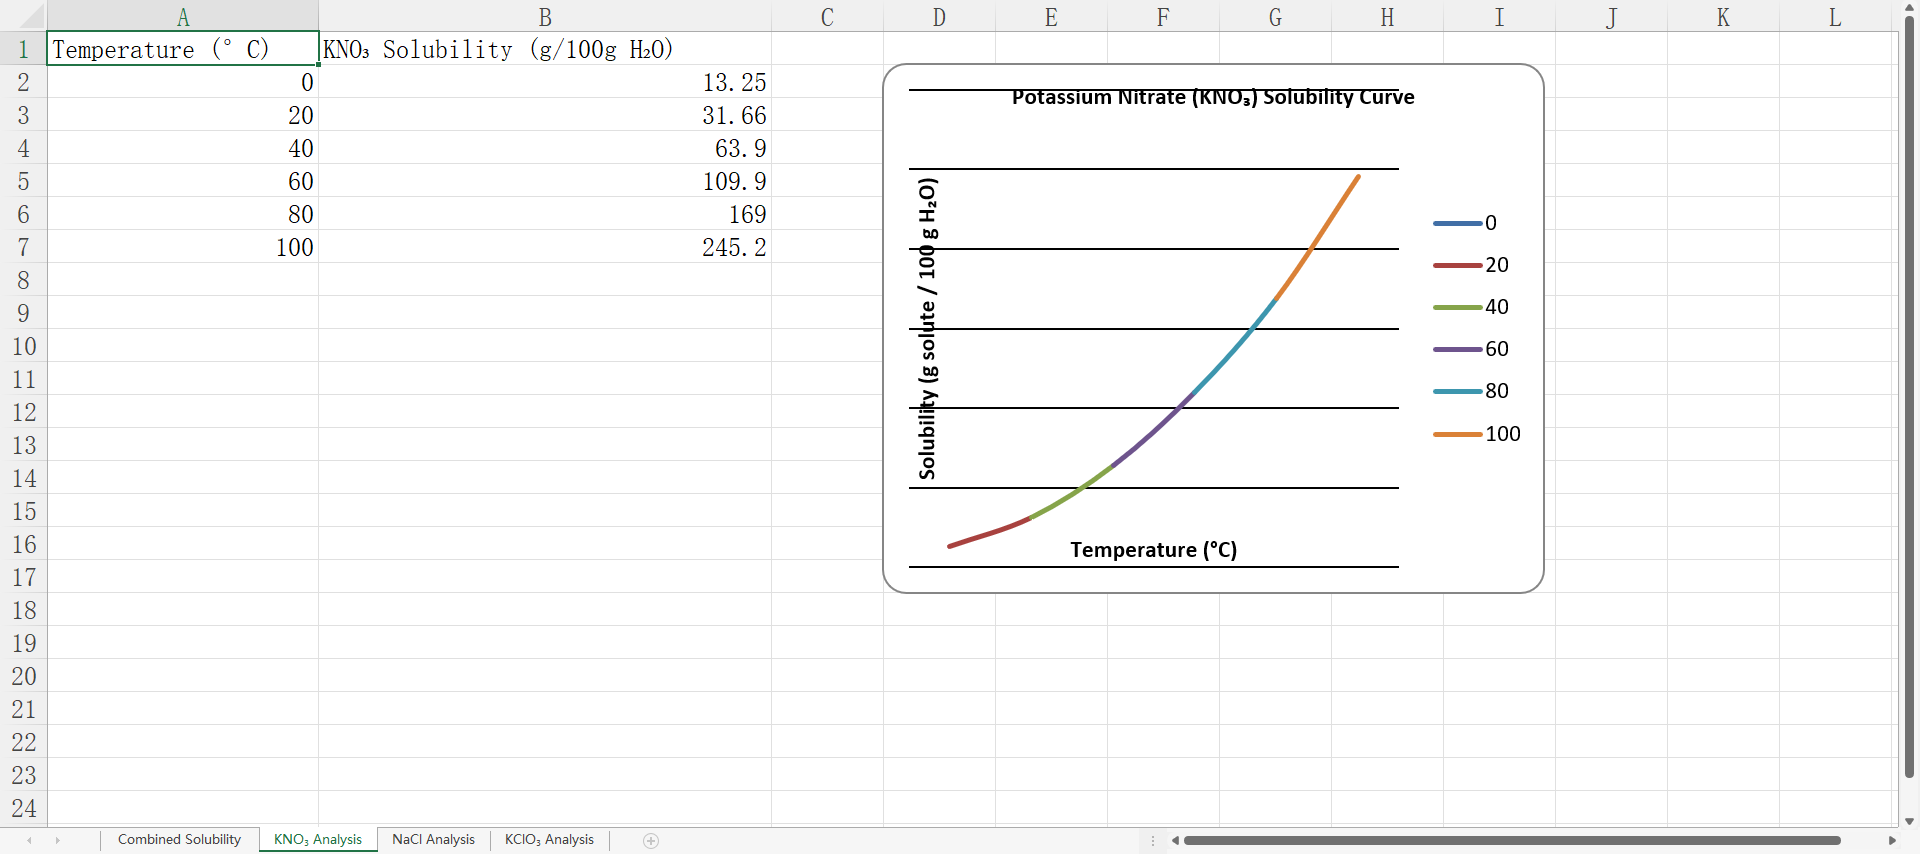
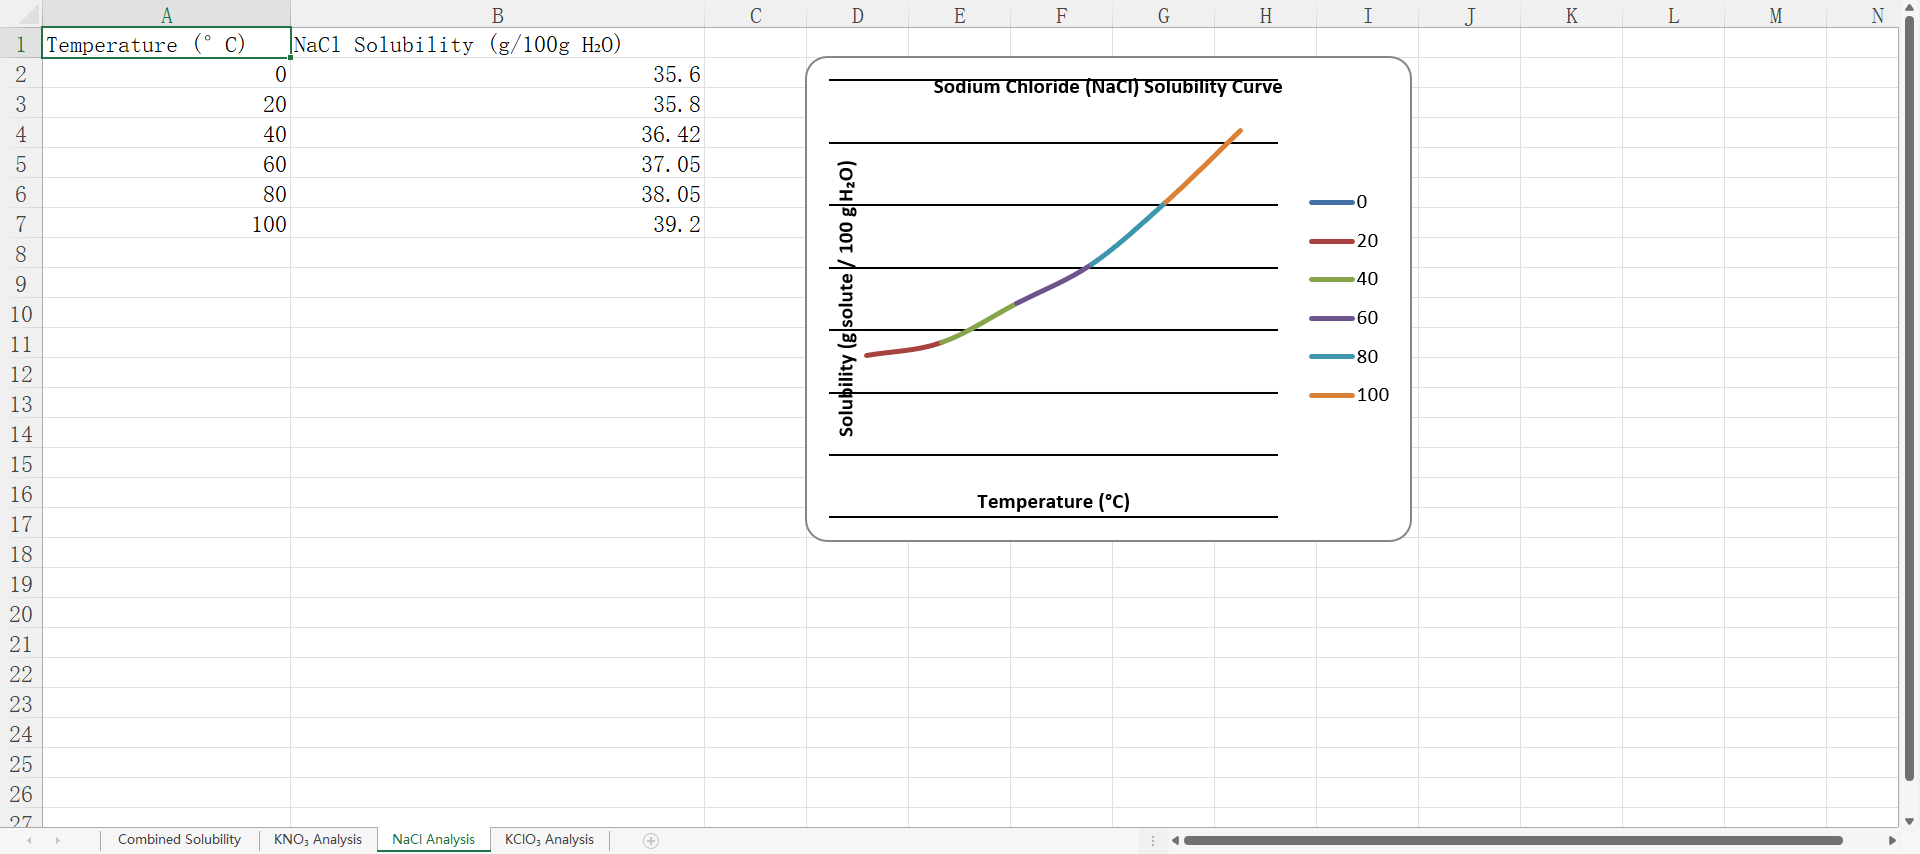
This function helps chemistry educators organize, calculate, and visualize experimental or classroom data efficiently. Teachers can input chemical experiment results (such as titration data, solubility measurements, or reaction rates) and instantly generate tables with formulas, averages, and trend analyses. It is especially useful for grading lab reports, managing student data, and creating datasets for further visualization.
Demo case credit cost: –124
Manus generated four spreadsheets, one combined sheet and three individual ones for each element. The data in the spreadsheets is factually correct, and the axes and charts are arranged reasonably.
Website Builder
This function helps chemistry educators create interactive websites for teaching without coding knowledge. Teachers can build course websites, lab pages, or project portfolios to share experiments, knowledge, and student work. It allows flexible customization, integrates multimedia, and promotes student engagement through accessible and visually appealing design.
Demo website credit cost: –127 (can cost over 500 when generating a complex website)
The website builder function provides a transparent and interactive process. Sometimes it pauses during generation to give users autonomy in choosing specific features or layout styles, which enhances customization and control. The resulting website is responsive and visually well-organized, the layout automatically adjusts to different screen sizes, making it accessible on both PC and mobile devices. The data and information presented on the generated site are factually correct, and users have access to all the files in this project for further modification.
Report Generator
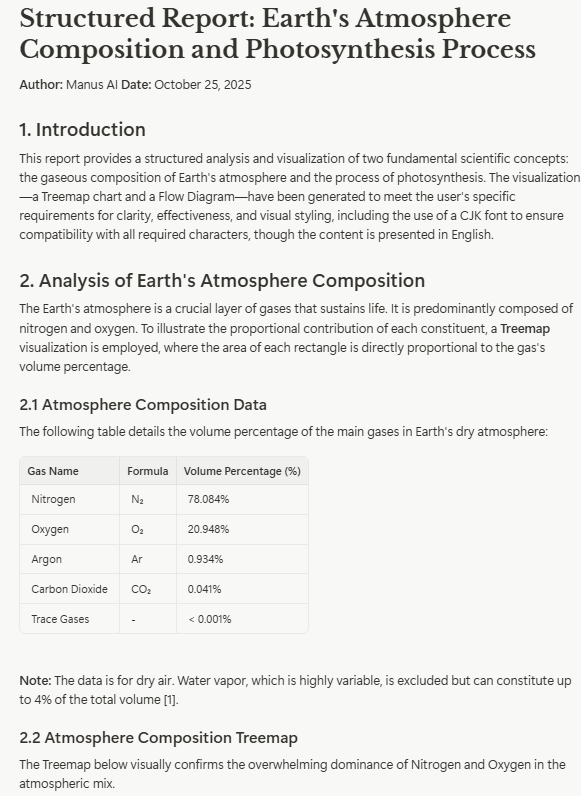
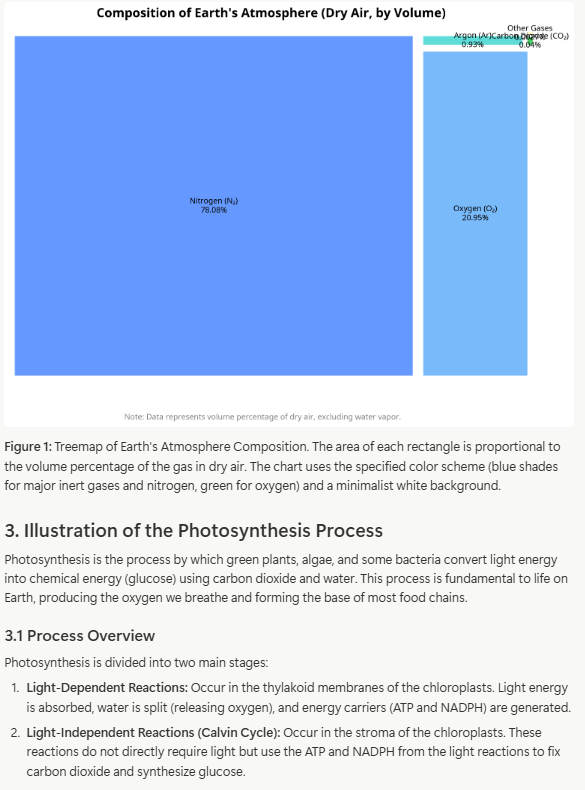
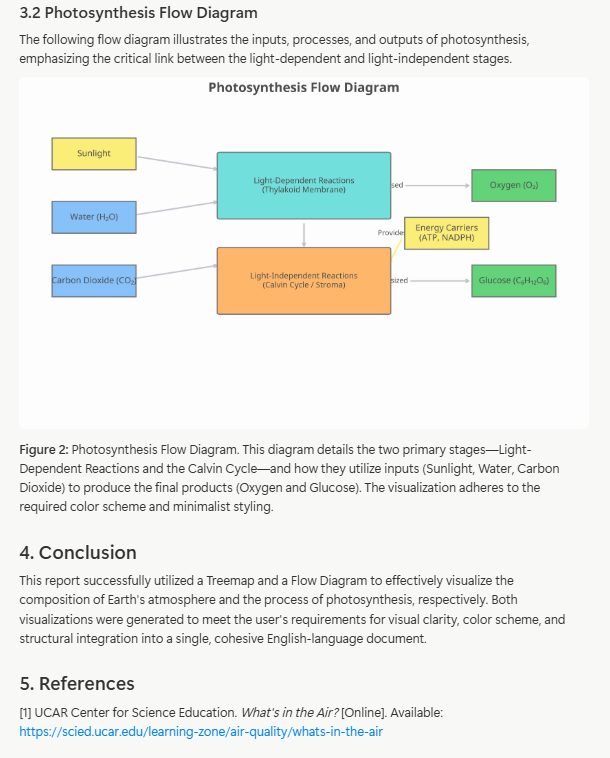
This function helps educators compile data, visuals, and explanations into structured reports. For chemistry education, it can generate charts, maps, lab summaries, experiment reports, or research overviews. It saves time and supports students in learning how to structure scientific documentation effectively.
Demo case credit cost: -21
It generated a well-structured outline with an introduction, body paragraphs, supporting evidence, conclusion, and references. The interface includes a convenient menu bar for navigating through the essay's chapters. However, one flaw was observed: for certain chemical formulas, the system used Markdown formatting, and when the file was exported as a .doc document, the chemical formulas appeared as garbled text.